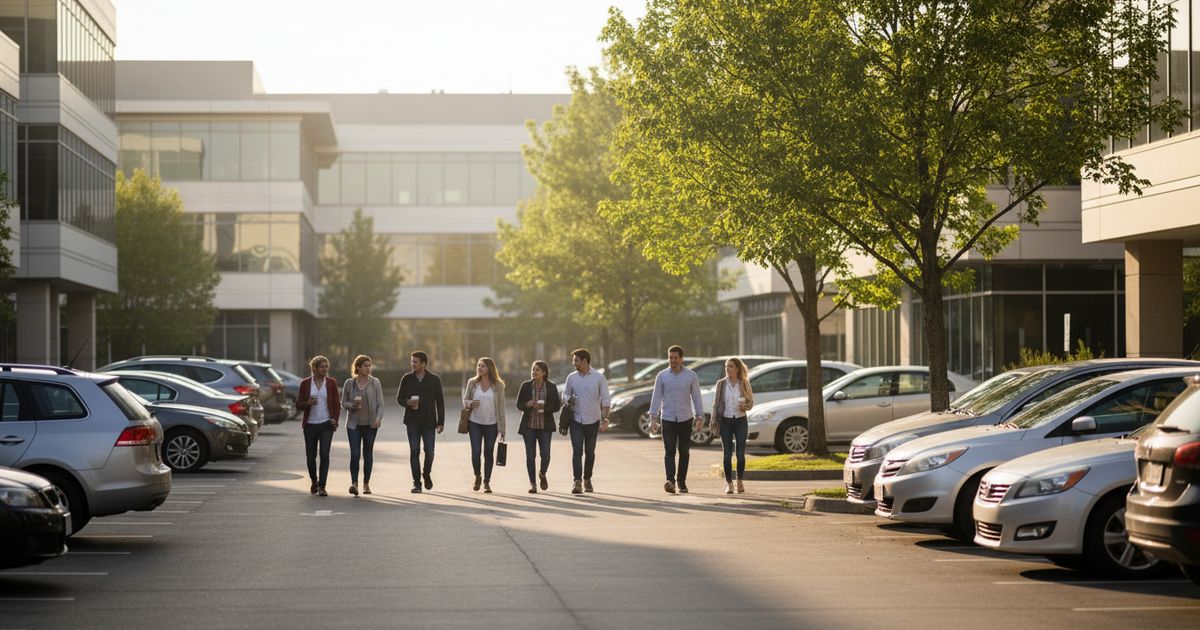
Employers often ask a reasonable question: if some of our staff share rides, how much difference could it make? This post works through a simple model to show how the arithmetic goes. To be clear from the start, this is a model, not measured results. The office is hypothetical, the shares are chosen for illustration, and nothing here describes the experience of any ShareSpace Carpool user.

The figure we start from
The US Environmental Protection Agency (EPA) estimates that a typical passenger vehicle emits about 400 grams of CO2 per mile. It also estimates about 4.6 metric tons of CO2 per year for a typical passenger vehicle, based on average annual mileage. Your own vehicle may be higher or lower depending on fuel, fuel economy and how far you drive, so treat 400 grams as an average and not a promise about any particular car.
The assumptions of our imaginary office
For this example, we use round numbers so the math is easy to follow:
- The office has 100 employees, and each drives alone today in a separate car.
- The commute is 20 miles one way, so 40 miles a day round trip.
- People work 250 days a year.
- Each solo driver therefore drives 40 x 250 = 10,000 commute miles a year.
- At 400 grams per mile, that is 10,000 x 400 = 4,000,000 grams, or 4 metric tons of CO2 per car per year from commuting.
With 100 solo drivers, the office baseline in this example is 100 x 4 = 400 metric tons of CO2 per year.
Scenario arithmetic: sharing two to a car
Now suppose some commuters pair up, two to a car. Each pair takes one car off the road, so the number of cars removed is half the number of people who share.
- 10 percent share: 10 people make 5 pairs. That removes 5 cars. 5 x 4 = 20 metric tons less, from 400 to 380, a 5 percent drop in this example.
- 20 percent share: 20 people make 10 pairs. That removes 10 cars. 10 x 4 = 40 metric tons less, from 400 to 360, a 10 percent drop.
- 30 percent share: 30 people make 15 pairs. That removes 15 cars. 15 x 4 = 60 metric tons less, from 400 to 340, a 15 percent drop.
Notice the pattern. Because sharing two to a car halves the cars for those people, the office-wide drop is half the share of people who carpool. Larger groups per car would change the numbers, and so would different commute lengths.
Adjusting for detours
The simple version above ignores something real: the driver may go out of the way to pick up a partner. Suppose, for example, the driver adds 2 miles each way. That is 4 extra miles a day, or 4 x 250 = 1,000 miles a year per carpool car. At 400 grams per mile, that is 400,000 grams, or 0.4 metric tons per carpool car.
Applying that in the same scenarios: 5 pairs add 2.0 tons, so the net saving is 18 tons. 10 pairs add 4.0 tons, for a net 36 tons. 15 pairs add 6.0 tons, for a net 54 tons. The saving is still real in this model, but smaller. Choosing pickup points near the route keeps it larger.
Limits of the model
- Empty seats and no-shows. Real carpools do not run every single day. If a partner is away, the pair may drive separately that day.
- Behavior change. Some people who join may have taken transit or lived closer. If so, their switch to a car would not reduce emissions.
- Averages. 400 grams per mile is an average vehicle. Electric, hybrid and older vehicles differ.
- Scope. The model counts commute tailpipe emissions only, not manufacturing, fuel production or other trips.
For more on how carpooling relates to emissions, see environmental benefits and your carbon footprint.
Reading the results sensibly
The scenarios show a direction and a rough size, not a forecast. A 10 percent participation rate is a modest goal for many offices and a stretch for others. The useful lesson is that the saving scales with how many people share and how far they travel. A longer commute multiplies both the baseline and the saving, while a short one makes the numbers small. Treat the output as a way to ask better questions about your own workplace.
What an employer can measure itself
Instead of relying on a model, an employer can collect its own simple data, for example through an anonymous commute survey:
- How many employees drive alone, share rides, use transit or work remotely.
- Average one-way commute distance.
- Number of carpool participants and how often they share.
- Parking spaces used on typical days.
With those numbers you can run the same arithmetic using your own figures. A practical starting point is our guide on how employers can start a carpool program. Staff can find partners and book shared rides in an app like ShareSpace Carpool, which offers cost-sharing prices capped to the shared cost of a trip.
Frequently asked questions
Is this what ShareSpace Carpool users have achieved?
No. This is a hypothetical model. We make no claim about emissions reduced by any user or group of users.
Where does the 400 grams per mile figure come from?
It is an EPA estimate for a typical passenger vehicle. You can look up the EPA's own explanation of how it is calculated for the details and assumptions.
Why does the saving shrink in the detour version?
Because the driver travels extra miles to pick up a partner, and those miles add emissions. The model subtracts them to show a more realistic net figure.
If your workplace wants to turn a model into real habits, a good first step is to let people find each other and try a shared commute in the ShareSpace Carpool app.
Ready to carpool?
Download ShareSpace Carpool, free on iPhone and Android.